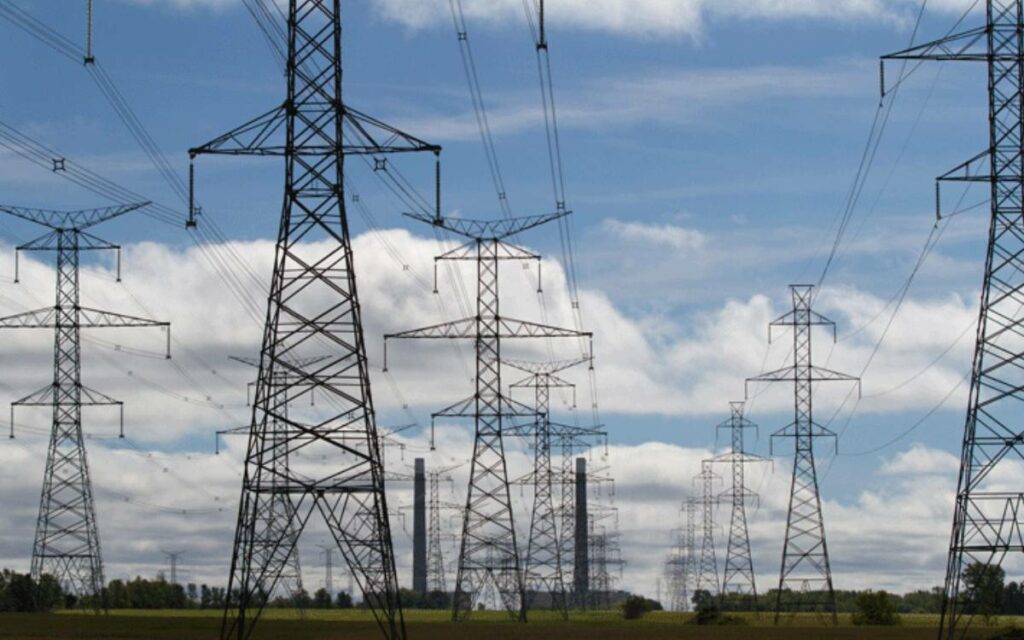
Power lines run from Ontario Power Generation in Bath, Ont. Photo credit: The Canadian Press/Lars Lagberg
Earlier this year the IESO (Independent Electricity System Operator) released its 2020 stats and noted Ontario’s electricity demand fell 2.1 per cent (down 2.9 terawatt hours [TWh]) from 2019, or about what 325,000 average households would consume in a year.
In 2020 the first full lockdowns in Ontario started in late March and basically stayed in place until late June/early July when some relief was allowed. The current year’s lockdown looks very similar! So, did the 2021 lockdowns result in further consumption reductions compared to the same quarter in 2020?
As it turns out consumption in the current April, May, June quarter saw a jump of 1.4 TWh compared to the same three months of 2020. That 1.4 TWh increase (up 4.7 per cent) represents what 625,000 average Ontario households would consume in three months. Ontario’s ratepayers consumed 29.724 TWh in the three months of 2020 and in 2021 consumption jumped to 31.130 TWh.
The GA (global adjustment) for 2021 totaled $2.687 billion – adding the average of the HOEP (hourly Ontario energy price) of $15.50/MWh for the three months brings the total cost to Ontario’s ratepayers and taxpayers (taxpayers are now picking up a large portion of the electricity costs) to $3.169 billion! The latter total indicates an average cost of approximately 10.2 cents/kWh (kilowatt hour), with the math simply being: $3.169 billion divided by consumption of 31.130 TWh.
The GA for 2020 was considerably higher as the Ford government capped the GA at $115/MWh (megawatt hour) due to the concern it would spike, so it totaled $3.825 billion, and coupled with the average HOEP (average $8.10/MWh for the three months) brought the total cost to $4.066 billion. That means the cost per kWh in 2020 for the same three months looks to be about 13.7 cents/kWh.
So, one should wonder, why the drop in average costs if consumption increased 4.7 per cent?
Well, as it turns out our net exports (exports minus imports) declined 2.9 TWh. So, in 2021 that decline saved Ontarians about $425 million for those three months as we didn’t have to eat the GA of $115/MWh and the average HOEP (the sale price) was higher (up $7.40/MWh), so in 2021 we got a little more for each MWh we sold. Additionally, curtailed wind declined by 183K MWh* saving us another $22 million. I suspect we also didn’t spill as much hydro or steam-off nuclear which would also have reduced 2021 costs, but that information is not disclosed as yet. Less solar generation in 2021 may also have played a role at reducing costs.
It becomes obvious Ontario’s grid – supplied principally with nuclear and hydro supplemented by gas generation – would produce lower costs. For all of 2020 nuclear and hydro supplied 94.3 per cent of Ontario demand and cheap and reliable gas easily supplied the balance. The intermittent and unreliable supply of wind and solar at the exorbitant contracted 20-year rates does nothing to reduce emissions while burdening ratepayers and taxpayers with much higher costs.
The three-month comparison highlights the mess created by the previous Liberal government(s) under the leadership of the McGuinty/Wynne terms in office and their enactment of the Green Energy Act, coupled with those contracts signed with wind and solar generators during their time in power.
*Thanks to Scott Luft for tracking industrial wind generation and curtailment monthly.
Parker Gallant is a retired banker. His work has been featured numerous times in the Financial Post, amongst other places. This piece originally appeared on his blog Parker Gallant Energy Perspectives. Reprinted here with permission.


