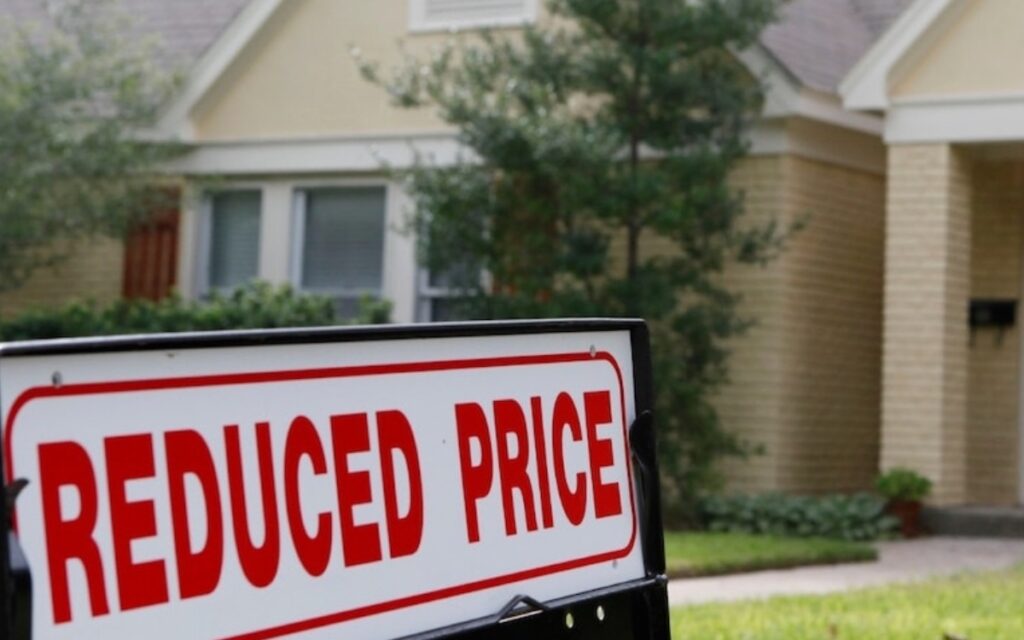
After reaching $825,300 in March 2022, Niagara’s Housing Price Index (HPI) benchmark has fell a full 20 points down to $661,900. Photo credit: ABC News
The Bank of Canada’s aggressive interest rate hike campaign and uncertainty around the future state of Canada’s economy continue to cool what was a red-hot housing market across much of the country throughout the latter half of the pandemic.
For the sixth time in a row, Niagara home prices fell on a month-over-month basis in September, following several successive price increases dating back to summer 2021.
Between August and September 2022, the local Housing Price Index (HPI) composite benchmark dipped by 3.7 per cent, going from $687,500 to $661,900. The month prior, the HPI fell by 4.1 per cent, and the month before that it dropped by 4.9 per cent.
Calculated using a sophisticated statistical model that considers a home’s quantitative and qualitative features, HPI provides a more stable price indicator than average prices, as it tracks changes to ‘middle-of-the-range’ or ‘typical’ homes and excludes extreme high-end and low-end properties.
Last month’s HPI represented the first decrease (0.8 per cent) in local year-over-year prices since before the start of the pandemic. In other words, housing prices were lower last month than the same month the year previous for the first time in a long time.
“Our market in Niagara continues to soften,” Niagara Association of Realtors (NAR) president Jim Brown said in a press release last week. “Although inventory is up, sales have slowed resulting in a continued reduction in overall average prices.”
In total, a mere 399 residential properties exchanged hands in September 2022, down from 457 in August and 707 units in September 2021.
The average number of days on the market jumped from 31 in August to 37 last month, and up from 22 the year prior. The number of new listings last month was 1,177, up from 1,095 in August.
From Pelham to Port Colborne, every municipality in the NAR service area once again experienced a month-over-month price drop.
In Niagara’s largest municipality, St. Catharines, the HPI benchmark fell by 3.7 per cent from $617,900 in August to $595,100 in September. The month prior it fell by 4 per cent.
In Niagara Falls, where prices consistently and most closely approximate the average HPI across the region at large, prices dropped 4 per cent from $677,400 to $650,300.
After experiencing fairly significant dips of 7.2 and 4.2 per cent in June and July, respectively, Welland saw its month-over-month HPI price effectively flatline in August. However, last month the central Niagara city’s HPI dropped another 4.1 per cent from $573,700 to $550,200.
Surpassing Welland as Niagara’s most affordable market, prices in Port Colborne/Wainfleet dropped 5.1 per cent last month, nearly $30,000, down to $544,900.
Niagara’s least affordable place to purchase property, Niagara-on-the-Lake, saw its HPI fall by 3.7 per cent down to $1,101,100, after falling 6.3 per cent in August. The town remains the only locality in the region with an HPI above $1 million.
Niagara’s second least affordable place to buy a home, Pelham, experienced a 4.7 per cent HPI decrease, falling over $40,000 between August and September, down to $854,000.
Prices remained steady in West Lincoln, while Fort Erie, Thorold, and Lincoln all experienced moderate month-over-month price dips.
The HPI composite benchmark property for Niagara is currently a 1,276 square foot single detached home between 51 to 99 years old with three bedrooms, two bathrooms, forced air, natural gas and on municipal sewers.
The Niagara Association of Realtors service area excludes Grimsby and certain parts of West Lincoln. Those locations are included in statistics provided by the Realtors Association of Hamilton-Burlington.


