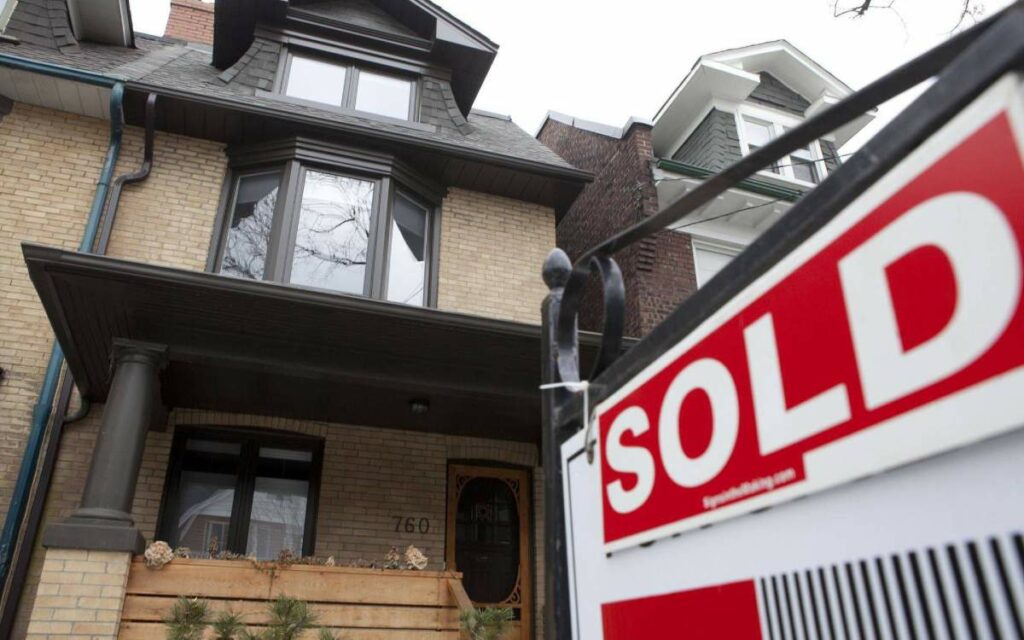
April was the first month in over a year in which housing prices rose in every municipality within the Niagara Association of Realtors market area. Photo credit: The Globe and Mail/Matthew Sherwood
Homes in Niagara are once again starting to sell for more, more quickly.
After rising for the first time in exactly a year in March, local home prices continued their upward recovery this past month.
According to data released by the Niagara Association of Realtors on Wednesday, the Home Price Index (HPI) composite benchmark price for Niagara rose 2 per cent from $641,600 to $654,100 on a month-over-month basis in April.
What’s more, the average number of days it took to sell a house dropped a dramatic 10 days from 41 in March to 31 last month.
“The Niagara Region has experienced a 2% increase in the HPI composite benchmark price, indicating an increase in consumer confidence,” Niagara Association of Realtors (NAR) president Amy Layton said in a press statement.
“The buyers are there and they want to buy, as indicated by the decrease in the average days on the market, increase in price in one month, and the same amount of sales with less listings available.”
After 12 months of decline, local home prices have now increased a total of 4.2 per cent over the last two months.
And for the first time in over a year, prices increased in every single market area around Niagara.
Niagara Falls, where prices consistently most closely approximate Niagara’s overall HPI month after month, saw the highest monthly bump in April, with prices jumping 2.5 per cent to $649,600.
Lincoln, which experienced the only price decrease from February to March, saw the second highest monthly price jump in April. The local HPI in Lincoln went up 2.4 per cent to $754,800.
St. Catharines also saw an above-average increase in price of 2.2 per cent between March and April, bringing the city’s HPI up to $600,400.
Fort Erie and Port Colborne/Wainfleet, Niagara’s two most affordable markets, saw the smallest price increases of 0.9 and 1.0 per cent, respectively.
Everywhere else around the region saw its HPI tick up between 1 and 2 per cent.
In terms of sales, the exact same number of residential properties, 560, exchanged hands in March and April. However, the number of new listings decreased slightly from 1,046 to 991.
Calculated using a sophisticated statistical model that considers a home’s quantitative and qualitative features, HPI provides a more stable price indicator than average prices, as it tracks changes to ‘middle-of-the-range’ or ‘typical’ homes and excludes extreme high-end and low-end properties.
The HPI composite benchmark property for Niagara is currently a 1,259 square foot single detached home between 51 to 99 years old on municipal sewers with three bedrooms, two full bathrooms, forced air, and natural gas.
The NAR service area excludes Grimsby and certain parts of West Lincoln, which are included in statistics provided by the Realtors Association of Hamilton-Burlington.


