
Every year when the provincial or federal budgets are introduced, the public gets bombarded with economic spin as the governments of the day seek to put lipstick on a pig. For the public, constantly experiencing unemployment, underemployment and a seemingly ever-increasing cost of living to go along with minimal income growth – these rosy statistics put out by government Ministers just does not seem to match their own realities.
Recently Ben Eisen and Milagros Palacios, academics with the Fraser Institute, put out several economic measures about Ontario’s economy over the last decade (2007-2016) to objectively measure its performance. Matching what most Ontarians are feeling, the results weren’t good.
Measure 1: GDP per person – (gross domestic product is a measure of all the goods and services produced in the economy per year) – Ontario ranked seventh out of 10 provinces in inflation-adjusted GDP growth per person.
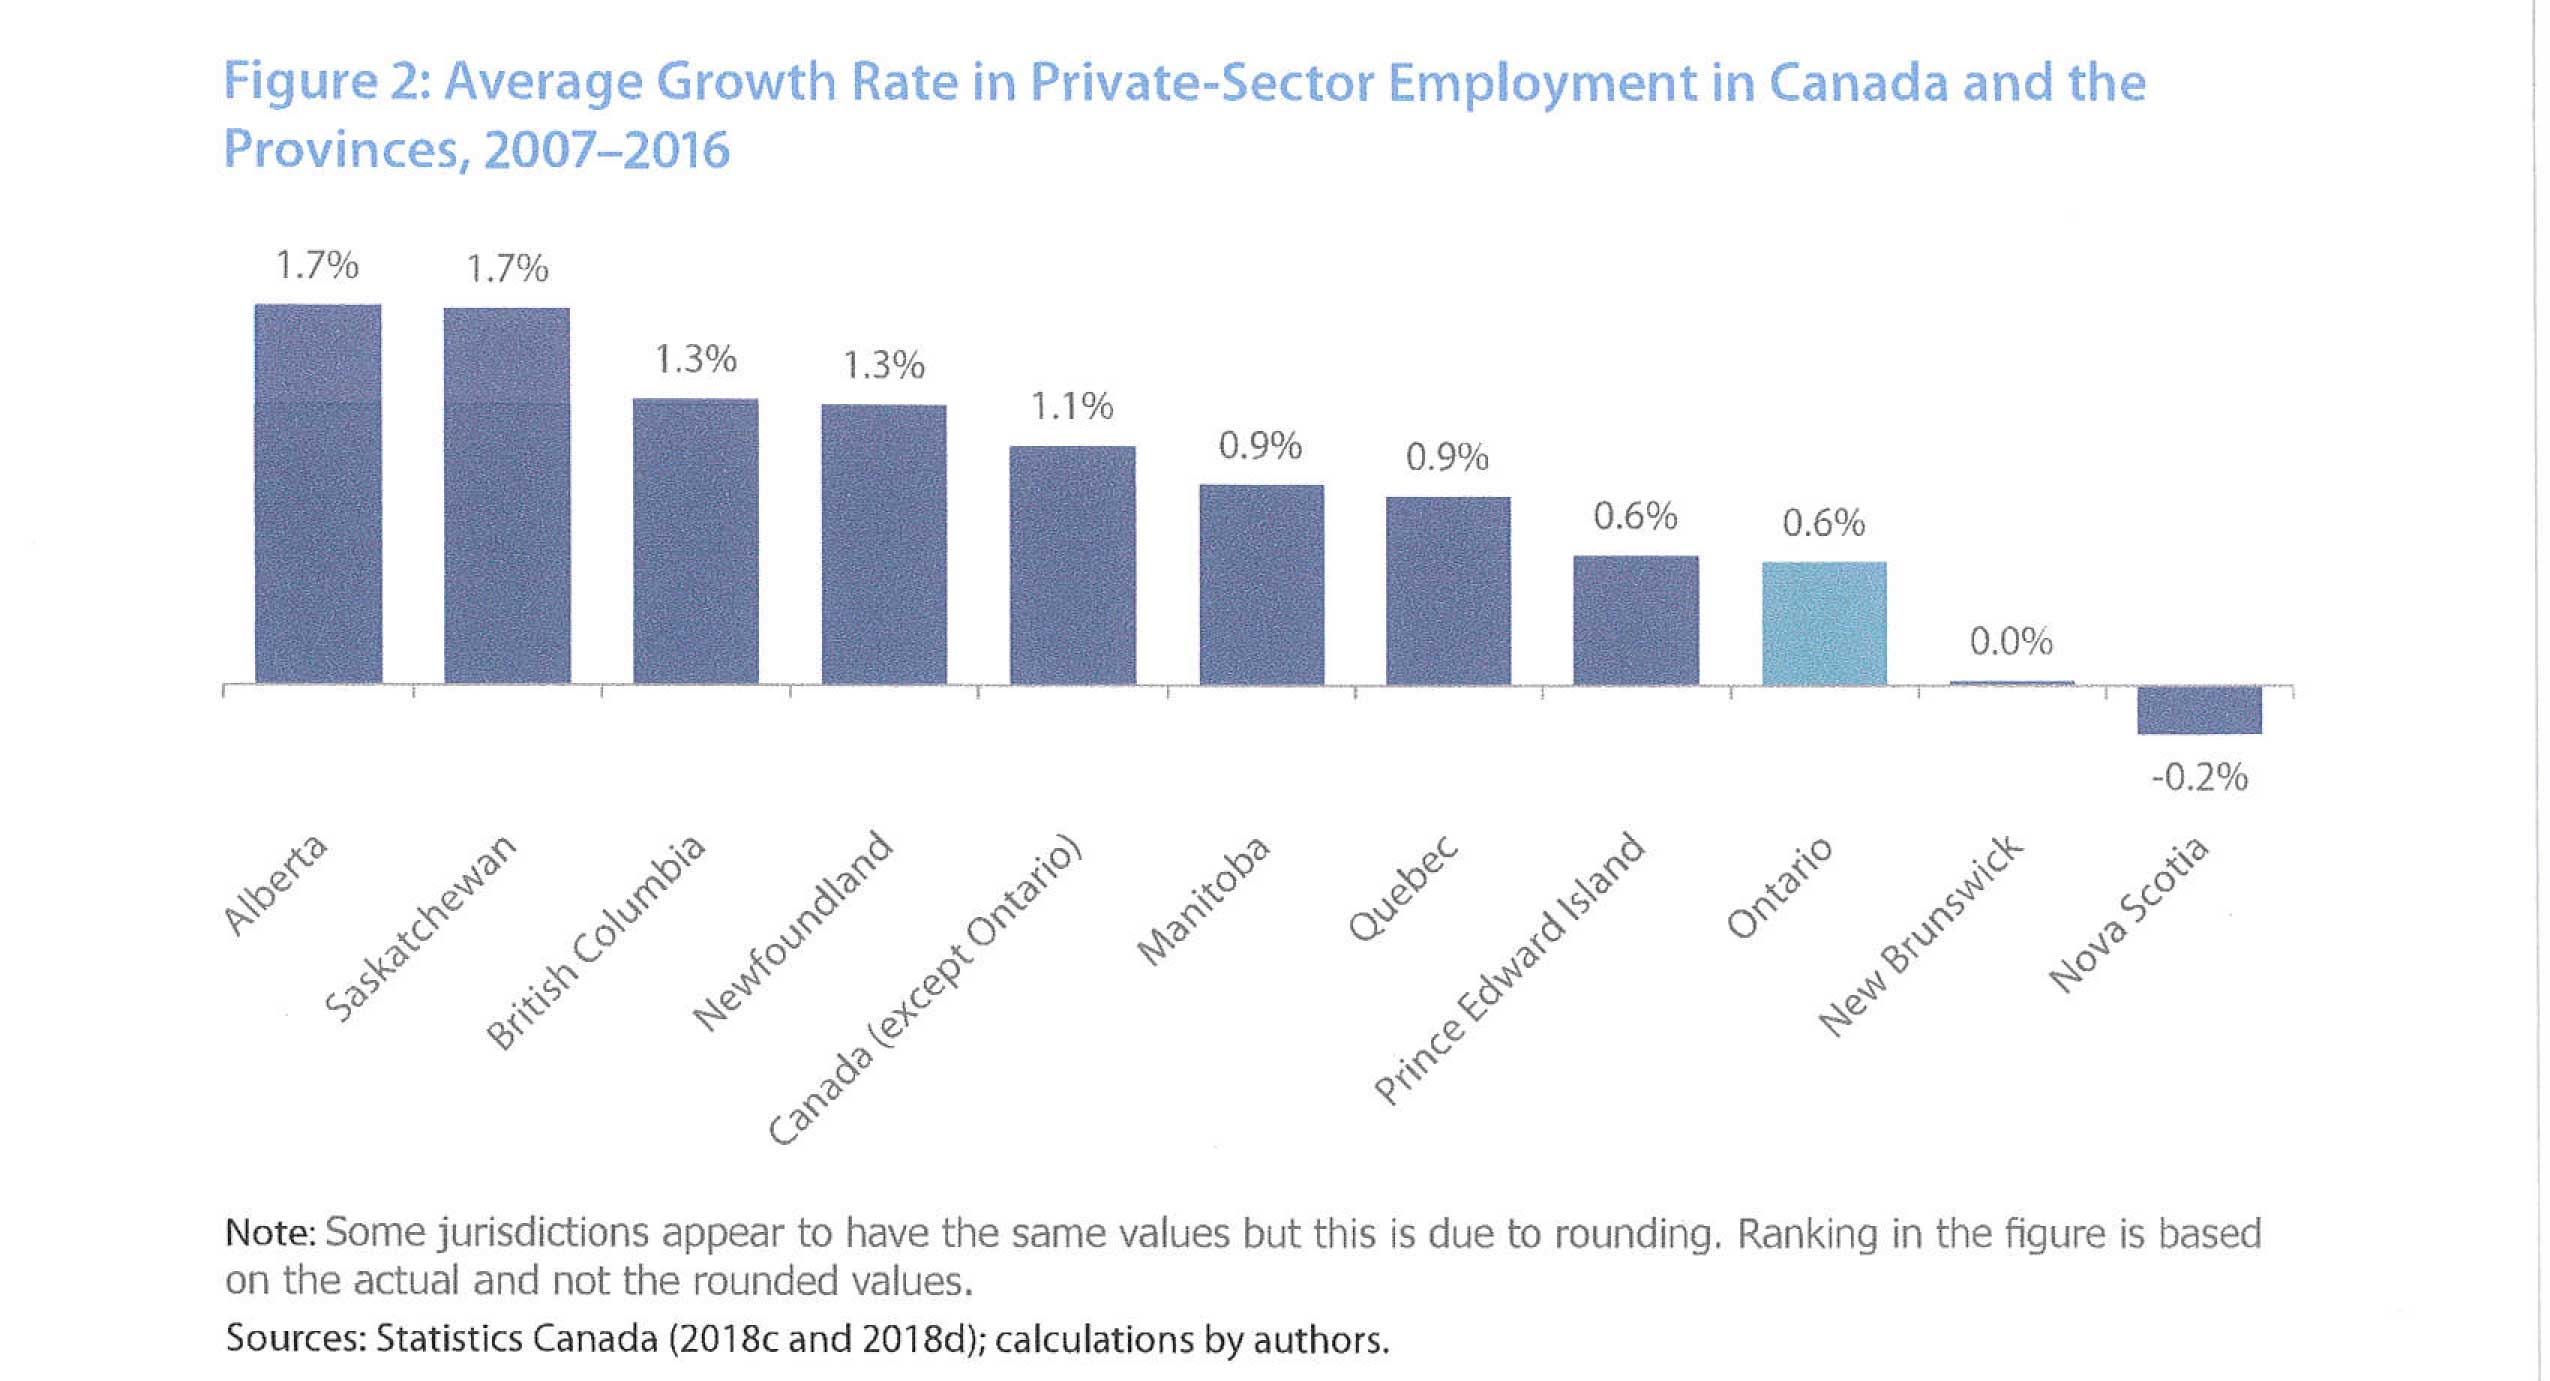
Measure 2: Private Sector Job Creation – The Rest of Canada (ROC) had an annual average rate of job creation of 1.1 per cent. “Ontario significantly underperformed the rest of the country for this metric, recording average annual private sector job growth of just 0.6 per cent.” Ontario ranks eighth out of 10 provinces.
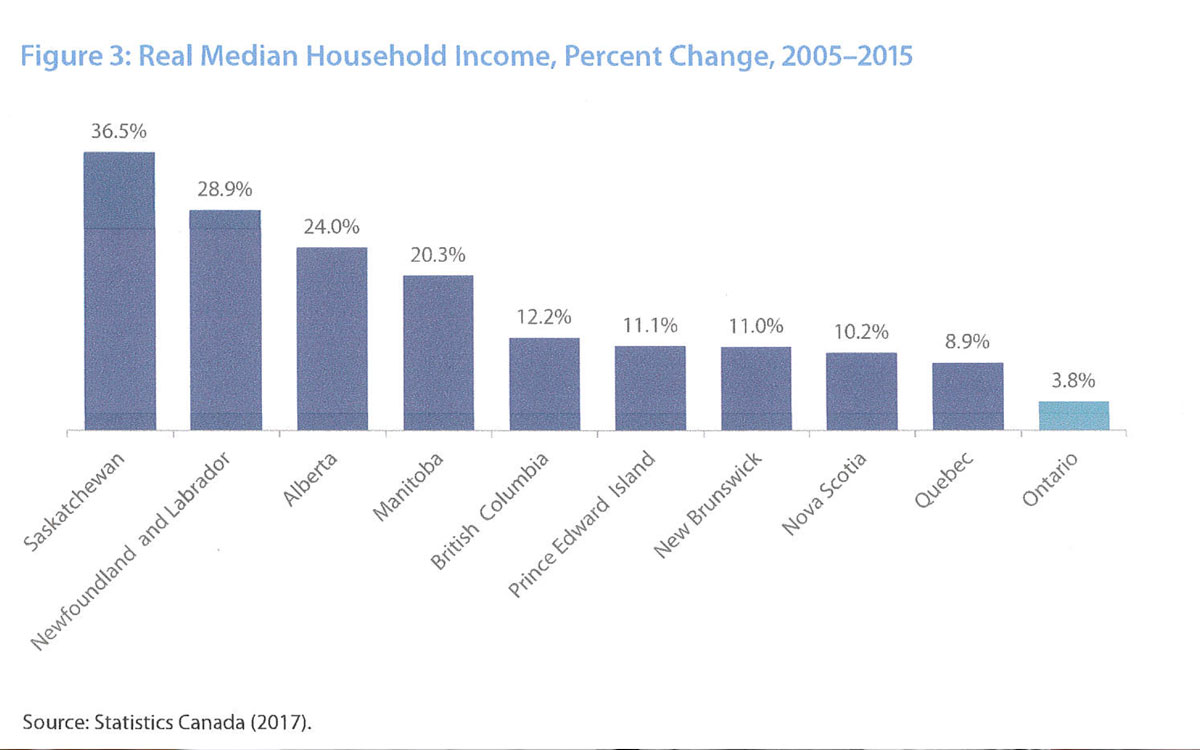
Measure 3: Household income – Real median household income is the level of household income at which there are an equal number of households above and below the level. From 2005 to 2015, Palacios and Eisen say that “Ontario’s performance on this metric is abysmal.” Indeed, Ontario ranks last in Canada in this measure. After inflation, “the median household income in Ontario increased in total by just 3.8 per cent over this period.” For comparison, the second lowest performer was Quebec where median household income increased by 8.9 per cent.
Measure 4: Public Debt Accumulation – Most Ontarians know that the current government has run deficits and added to the provincial debt pretty much the entire 15 years they have governed this province. But how bad is it for each of us? Between 2007 and 2016, Ontario’s net debt per capita increased by $9,313. This is four times as much new debt per person than top performer British Columbia.
So if you are like most people and you feel worse off economically here in Ontario over the last decade it’s for good reason.
Palacios and Eisen conclude by reminding readers that Ontario became a have-not province in 2009 and since then has received over $18 billion in equalization payments. Despite those billions in payments the debt has continued to grow while at the same time many public services have declined. In addition, the authors note that people have left Ontario for greener pastures. The measure of net migration shows that more people moved out of Ontario, moving to other provinces than moved in, over eight of the last 10 years.