Pace of price increase slows below one per cent. Average number of days houses on market remains steady at 30.
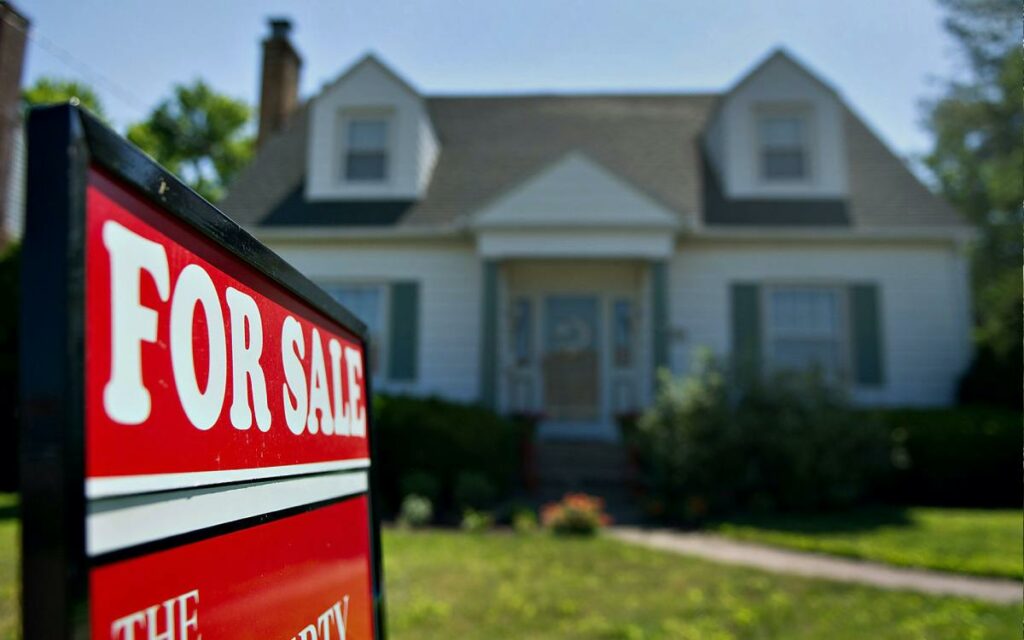
After tumbling for the better part of 2022 into early 2023, the Niagara real estate market continues its slow and steady climb back up.
For the fourth month in a row, home prices across the region ticked up in June.
According to the latest statistics from the Niagara Association of Realtors (NAR), the region’s Home Price Index (HPI) benchmark price rose a marginal 0.7 per cent from $662,400 in May to $667,100 in June.
The previous three months it rose 1.3, 2.0, and 2.2 per cent, respectively.
The slight price increase came despite the Bank of Canada’s surprise quarter-point interest rate hike on June 7.
In a press release Thursday, NAR president Amy Layton said Niagara is currently in a “balanced market”.
“Homes are taking a little longer to sell than they did at this time last year but 30 days average to sell is quite normal,” Layton said. “Month over month we are still seeing a moderate value increase, while the number of sales and new listings have a smaller gap, meaning we are in a balanced market.”
A total of 1,403 homes were listed for sale in June.
On a month-over-month basis, the number of sales dipped 10.8, with 604 properties exchanging hands. On a year-over-year basis, however, sales were up 26 per cent.
“Year over year for June, we are seeing more sales and less listings, indicating the Niagara Region is still a place people want to buy property.”
Everywhere but Niagara’s most expensive municipality, Niagara-on-the-Lake (where prices dipped less than half a percentage point), saw a modest month-over-month price increase.
Welland experienced the largest uptick across the region, with its HPI rising 1.4 per cent from $559,900 to $567,700.
Welland was followed by Thorold, where the HPI ticked up 1.2 per cent from May to June, and Port Colborne/Wainfleet, where it rose 1.0 per cent.
In Niagara Falls, where prices consistently and most closely approximate the region at-large, prices increased 0.8 per cent.
In Niagara’s largest municipality, St. Catharines, prices effectively flatlined.
All other municipalities in the NAR catchment area saw increases below one per cent.
Calculated using a sophisticated statistical model that considers a home’s quantitative and qualitative features, HPI provides a more stable price indicator than average prices, as it tracks changes to ‘middle-of-the-range’ or ‘typical’ homes and excludes extreme high-end and low-end properties.
The HPI composite benchmark property for Niagara is currently a 1,259 square foot single detached home between 51 to 99 years old on municipal sewers with three bedrooms, two full bathrooms, forced air, and natural gas.
The NAR service area excludes Grimsby and certain parts of West Lincoln, which are included in statistics provided by the Realtors Association of Hamilton-Burlington.


